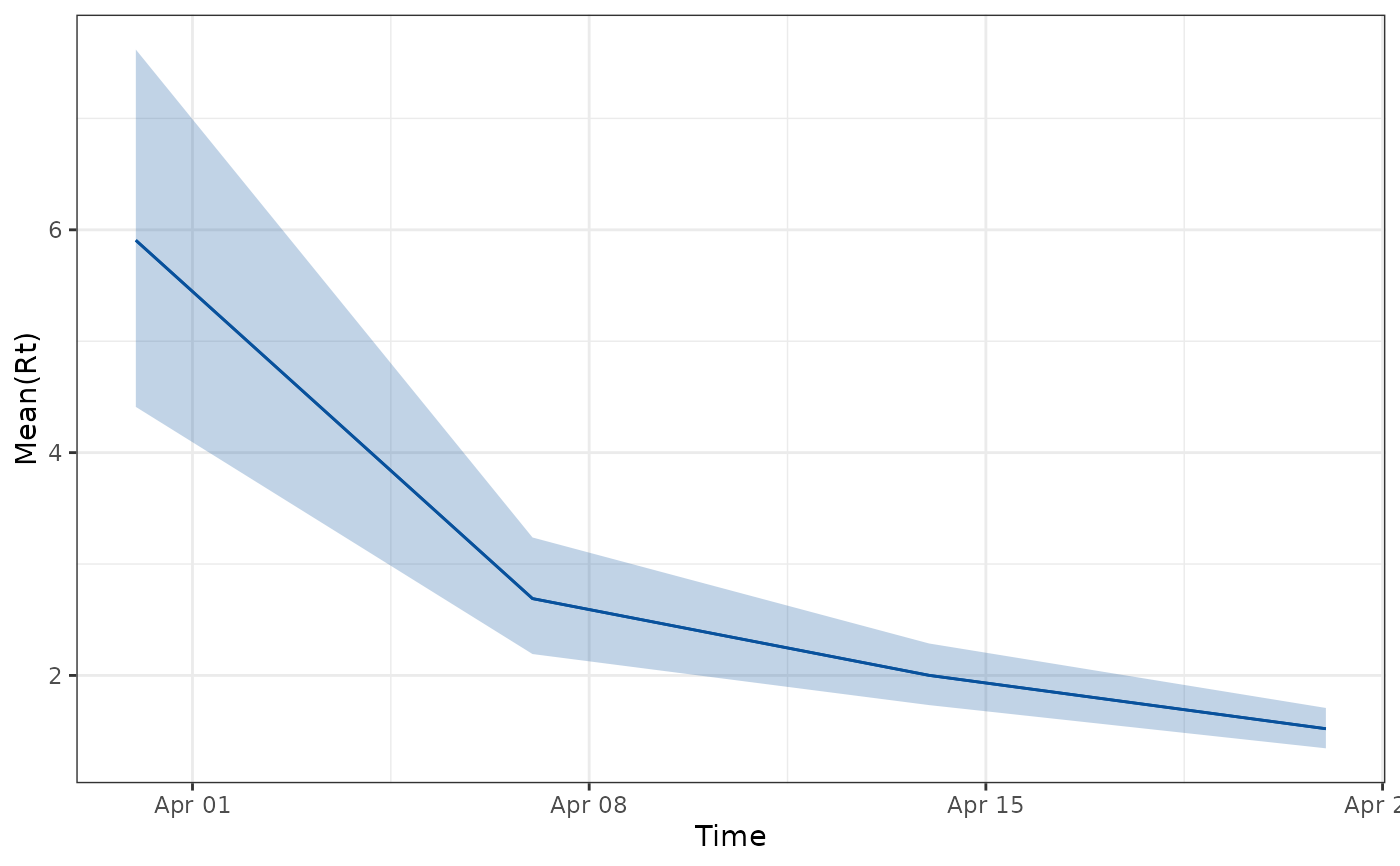
Plot Mean Rt with time index (dates)
Examples
# Create sample test rsv data
disease_type <- "rsv"
test_data <- simulate_data()
formatted_data <- get_aggregated_data(
  test_data,
  number_column = disease_type,
  date_column = "date",
  start_date = "2024-04-01",
  end_date = "2024-05-01"
)

# Run a 7 day forecast with smoothing
forecast_results <- generate_forecast(
  data = formatted_data,
  start_date = "2024-04-01",
  n_days = 7,
  type = "rsv",
  smooth_data = FALSE
)
plot_rt(forecast_results)