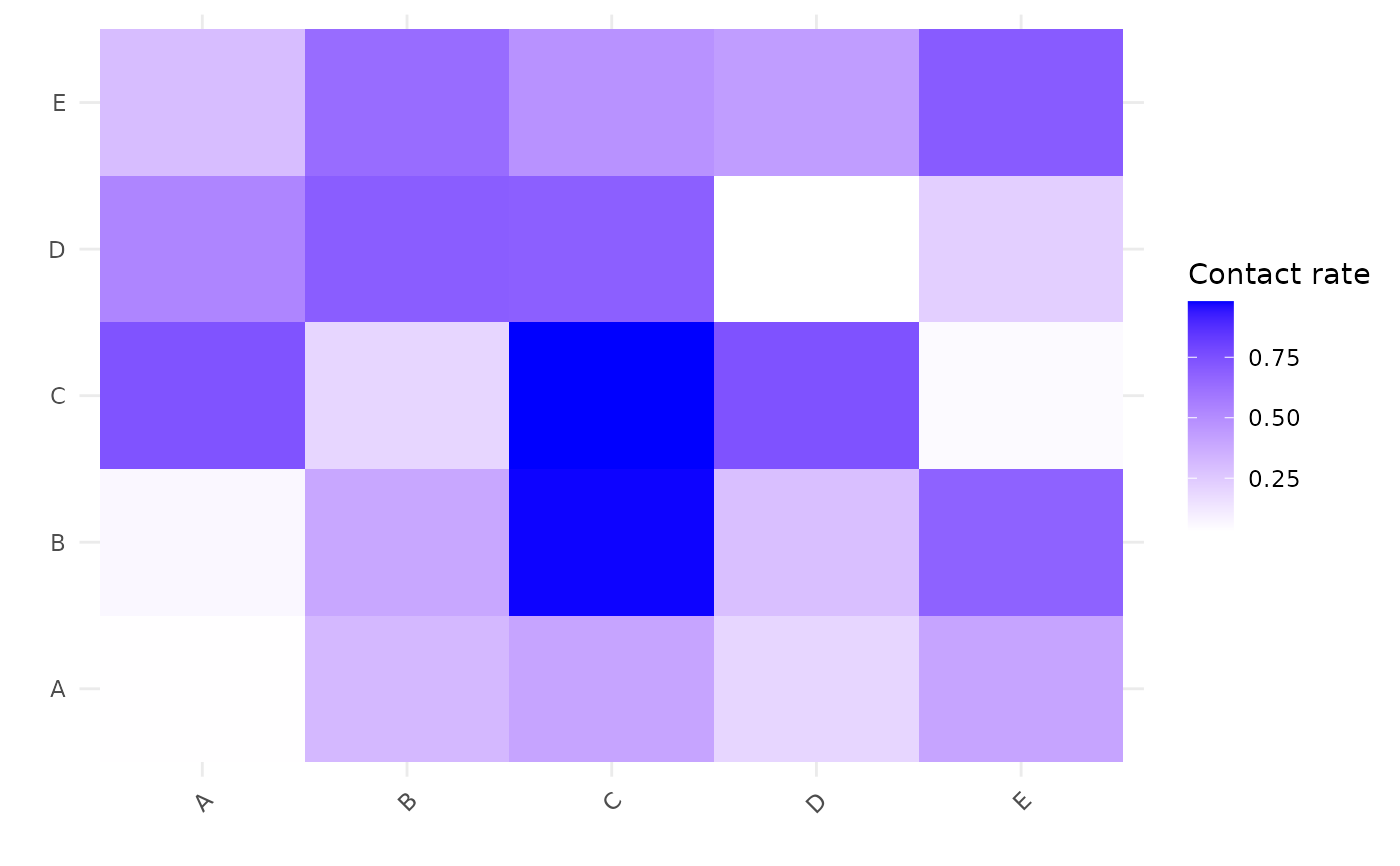
This function visualizes a contact matrix using a heatmap.
Usage
plot_contact_matrix(matrix_data, levels = NULL)
Arguments
- matrix_data
A square matrix where rows and columns represent different groups, and values indicate contact rates.
- levels
list of labels to order matrix
Value
A ggplot2 object representing the heatmap of the contact matrix.
Examples
contact_matrix <- matrix(runif(25, 0, 1), nrow = 5, dimnames = list(LETTERS[1:5], LETTERS[1:5]))
plot_contact_matrix(contact_matrix)