Plot Prior and Posterior Distributions with Optional True Value
Source:R/abc_stochastic_model.R
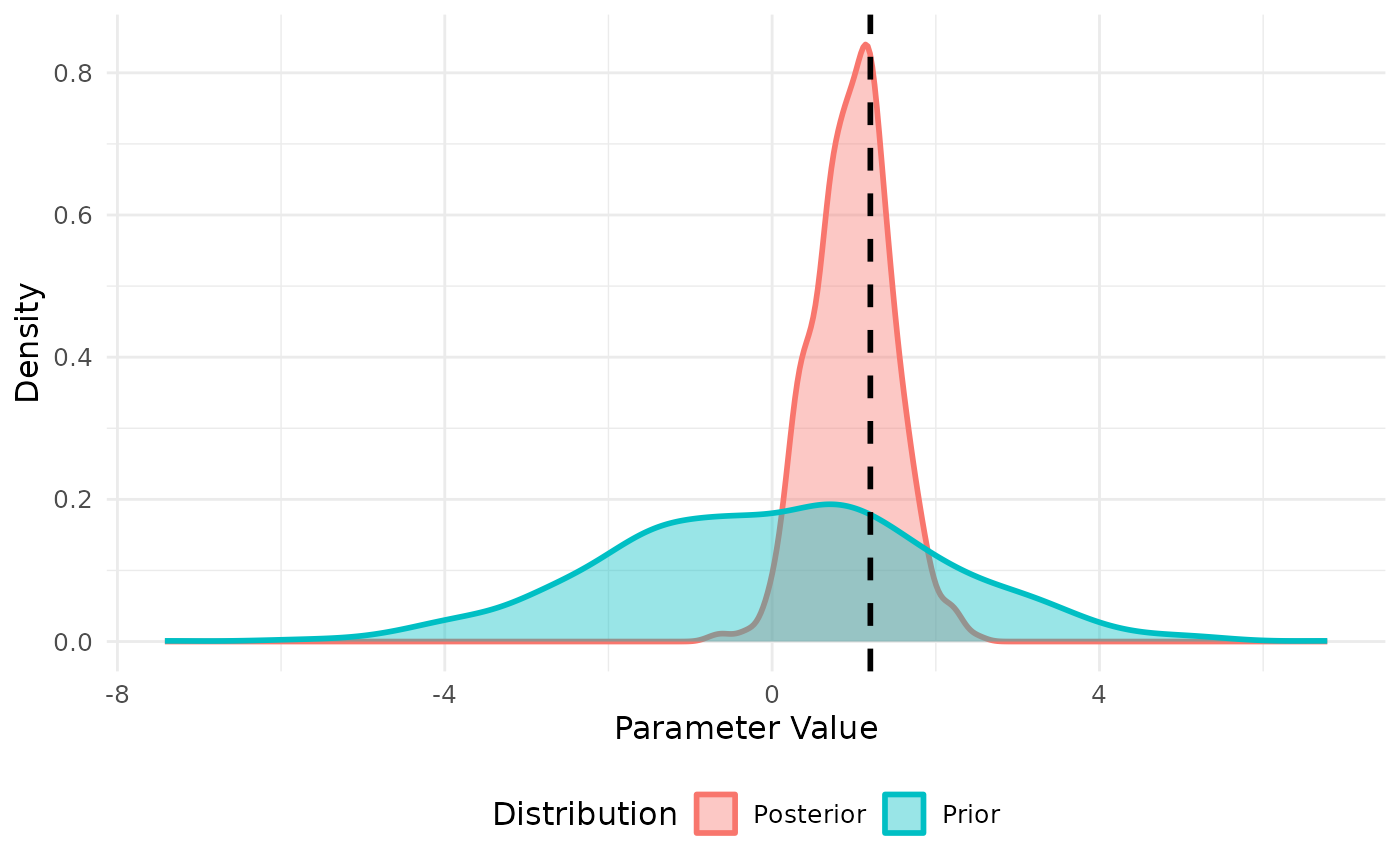
plot_prior_posterior.RdThis function generates a density plot comparing the prior and posterior distributions of a parameter. An optional vertical dashed line can be added to indicate the true parameter value.
Value
A ggplot2 object representing the density plot comparing the prior and posterior distributions.
Details
The function uses geom_density() to visualize both prior and posterior samples, and geom_vline() to optionally display the true parameter value. It uses theme_minimal() and places the legend at the bottom for clarity.